3.4.15. Waterfall Plots
Waterfall Plots display multiple spectrum data curves from one channel only. These plots:
- Require the selection of the following items on the Plot Creation tab before adding them to the plot grid:
- One primary data channel.
- One optional parameter or channel stat selection on the X axis input.
- Do not extend the Plot Menu with additional choices.
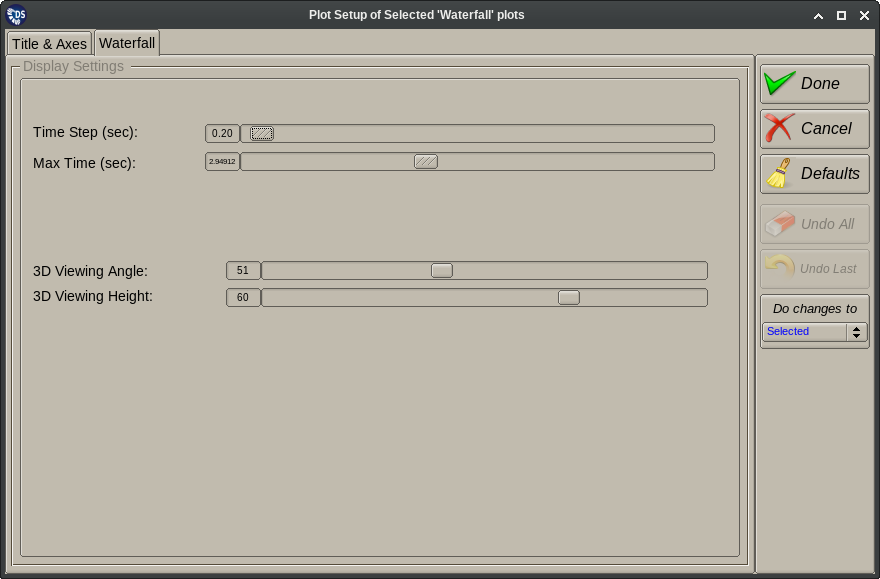
- Add an extra page to the Plot Setup dialog as shown below.
- Provide no additional user interaction mechanisms beyond the ‘standard’ ones described in the Plot Interactions section.
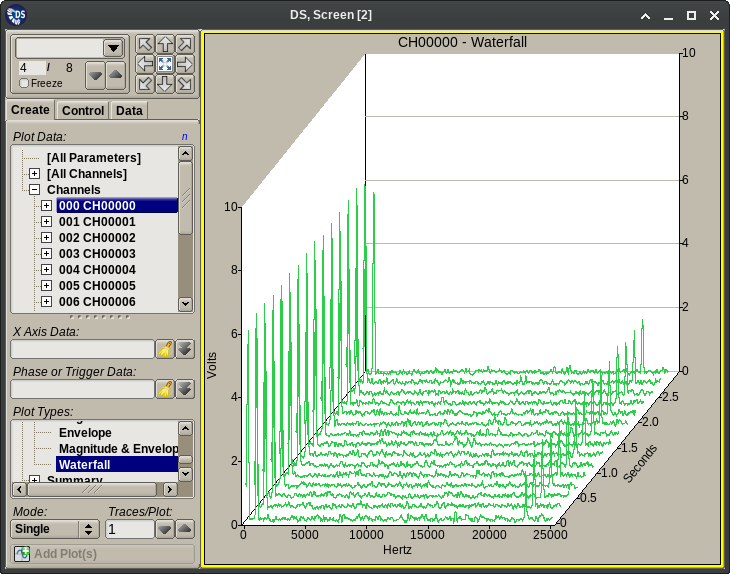
Waterfall plots are rendered as a 3D projection of multiple spectrum data curves. The X (horizontal) axis is frequency, the Y (diagonal) axis is a user selectable parameter and the Z (vertical) axis is spectrum magnitude. Each displayed curve is the maximum of several per block spectrum traces, collected according to the spacing of the waterfall lines.
Depending on the Y (parameter) axis variable waterfall plots can be rendered in one of two possible ways:
Time Waterfall plots display time delays on their Y (diagonal) axis. The most recent spectrum curve is always at the front and older spectrum lines will “scroll out” of the plot as time advances.
Parameter Waterfall plots map the range of the selected parameter or channel stat on the Y axis. In this case the Y axis is stationary, it will not scroll.
Note
The Y axis Waterfall Plot parameter or stat has to be selected on the X axis input field of the plot creation tab.
Waterfall plots add a second page to the Plot Setup dialog as shown on the image below. The purpose of this page is to adjust the spectrum line count and spacing of the plot. It is also possible to change the 3D projection angles on this page.

