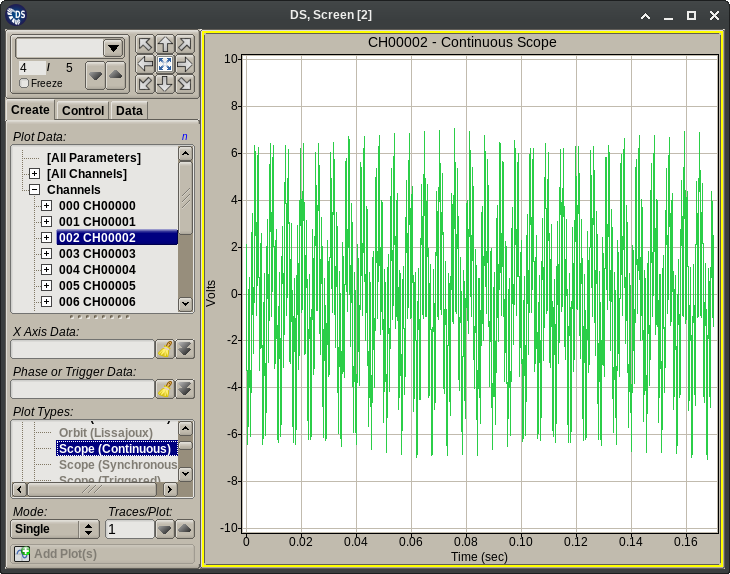
3.4.11. Scope Plots
Scope Plots display a configurable number of samples from one or more data blocks collected from one or more channels. These plots:
Require the selection of the following items on the Plot Creation tab before adding them to the plot grid:
- One or more primary data channels.
- For some sub-types a speed parameter used for triggering.
Do not extend the Plot Menu with additional choices.
Do not add extra pages to the Plot Setup dialog.
Provide no additional user interaction mechanisms beyond the ‘standard’ ones described in the Plot Interactions section.
Scope Plots operate on variable length sweeps of data samples. They collect these sweeps in double buffered mode. This means that while one buffer is displayed, the other one is collecting samples. Once the collection is done, the buffers switch roles. The sweep length is adjustable simply by changing the X axis range of the plot.
Scope Plots have three sub-types. These differ in how they start collecting a sweep’s samples and in the length of the collected sweeps.
- Continuous Scope plots start collecting the next sweep immediately after the previous one is completed.
- Triggered Scope plots require the selection of a trigger (speed) parameter when they are created. They will start collecting the next sweep’s samples upon the detection of the next trigger pulse.
- Synchronous Scope plots are similar to the triggered ones above, except that they also dynamically adjust the length of their sweeps based on the distance between successive trigger pulses. These plots scale their X axes in degrees instead of a time unit. The default 0 .. 360 degree scaling will display samples between two trigger pulses (these typically correspond to revolutions of a rotating part).
Tip
Due to the role the plot’s X axis range plays in determining the sweep length using any of the ‘auto’ axis range modes is discouraged.
