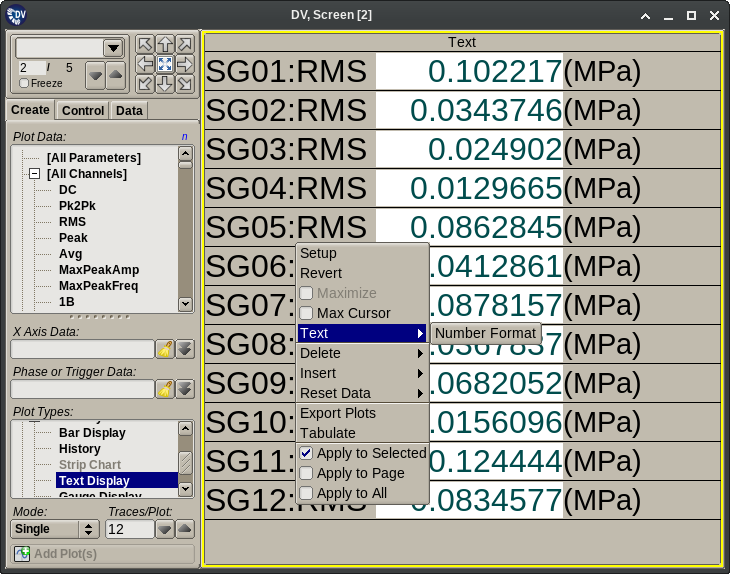
3.4.22. Text Plots
Text Plots display the current value of selected parameters or channel stats in a plot grid cell formatted as text. These plots:
Require the selection of the following items on the Plot Creation tab before adding them to the plot grid:
- One or more primary parameters or channel stats.
Extend the Plot Menu with an additional choice that will prompt the user for a C-style format string to use for printing the displayd numeric values.
Do not add extra pages to the Plot Setup dialog.
Provide no additional user interaction mechanisms beyond the ‘standard’ ones described in the Plot Interactions section. However, they do disable the plot data zoom interaction.
These plots use a text coloring scheme for indicating displayed data item alarm levels. The meaning of the colors is as follows:
- No Color: (white, gray) means that there are no alarm limits defined for the given stat or parameter.
- Green: means that limits are defined and the displayed value is below the alarm levels.
- Yellow: means that the displayed value has exceeded the warning (i.e. reduced alarm) level.
- Red: means that the displayed value has exceeded the its alarm level. Items that have no limits defined still can reach this state if they exceed a value computed from their monitoring limits defined during acquisition setup.
