3.4.5. Plot Interactions
Most data plots of the APEX DV application support several different ways for the user to interactively manipulate them. This section will describe the standard mechanisms that are supported by (almost) all plots. Additional methods may be supported by certain plot types. These will be described in their respective sections.
A typical APEX DV plot has different areas to interact with, possibly with different results:
- The data area of the plot is the inside of the inner plot frame where one or more data curves are drawn.
- The title area of the plot is the space between the inner and outer frames at the top of the plot.
- The axis areas of the plot are the spaces between the plot axes (X, Y, and for some plots a second Y axis on the right) and the outer frame at the bottom and side(s) of the plot.
3.4.5.1. Plot Selection
A mouse click with any button anywhere inside the plot cell’s outer frame will select the plot cell. Cells can be selected regardless of whether they are empty or display a plot. Depending on the mouse button used and some keyboard modifiers the following effects are possible:
- A click with the primary (left) mouse button will select the target plot cell exclusively. Any previous selections will be undone.
- A primary button click with the Control key held down will toggle the target cell’s selection status.
- A primary button click with the Shift key held down will extend the selection to all cells between the target cell and the last selected one.
- A secondary (right) button click will select the target plot followed by the display of the Plot Menu which will be described in the next section.
Tip
If the target cell is not empty and if the only goal is to select the plot, then it is best to click over the title area. This will avoid unintended side effects.
3.4.5.2. Arranging Plots
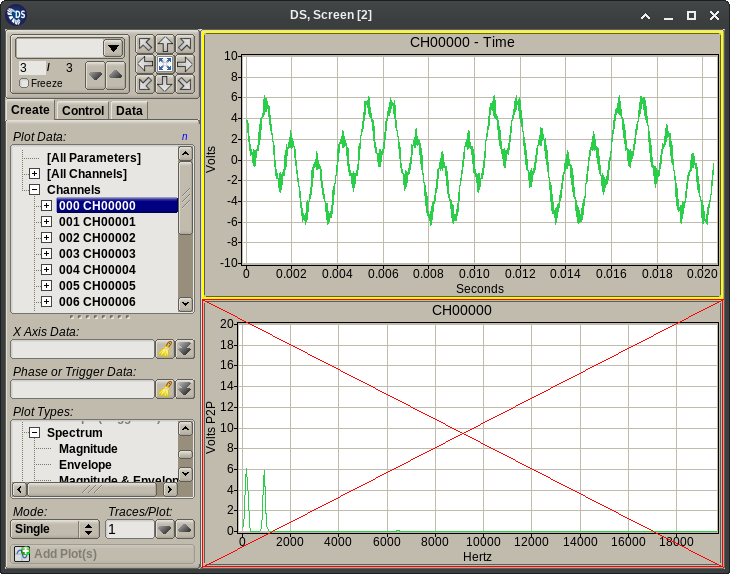
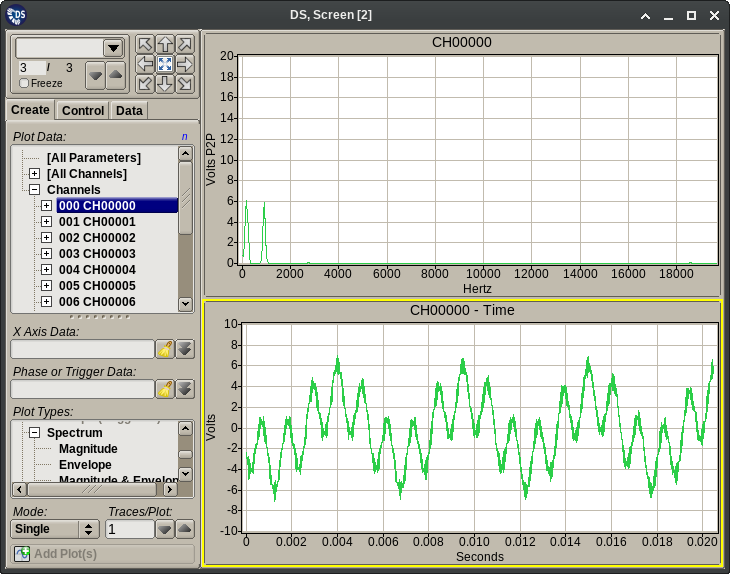
An initial mouse button press over a non-empty plot cell’s title area can be followed by a dragging action with the button continuously held down. This will allow moving the selected plot to a different plot grid cell. Upon releasing the button the move will be completed.
3.4.5.3. Plot Zooming
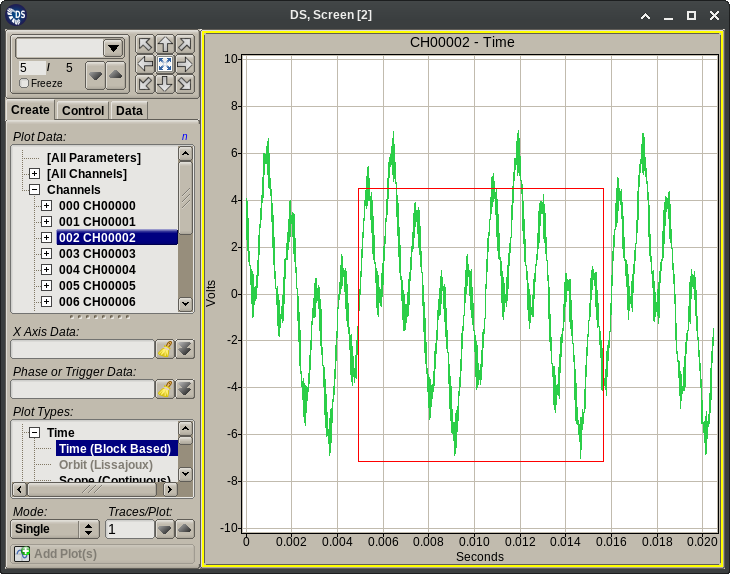
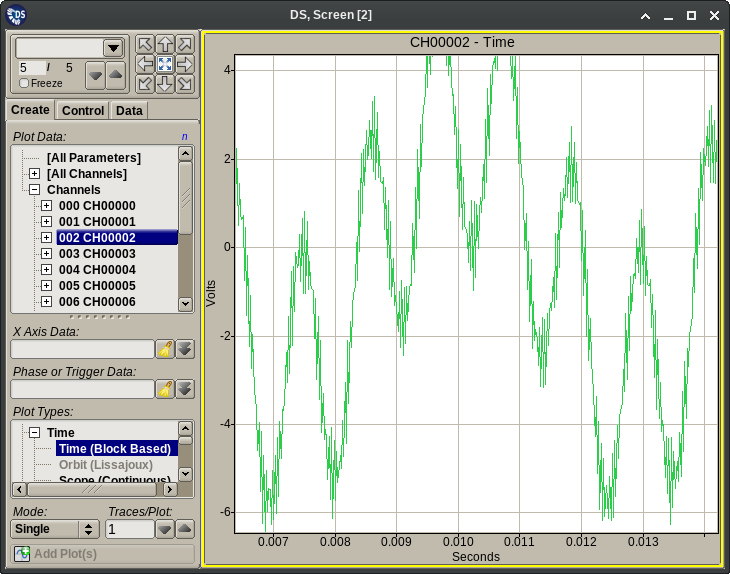
An initial mouse button press over a non-empty plot cell’s data area can be followed by a dragging action with the button continuously held down. This will draw a temporary selection box over the plot’s data. Upon releasing the button the plot’s axis scaling will be temporarily changed to display only the selected area. This zooming action can be repeated multiple times. The original (i.e. not the previously zoomed) plot scaling can be restored from the Plot Menu described in the next section.
3.4.5.4. Plot Cursors
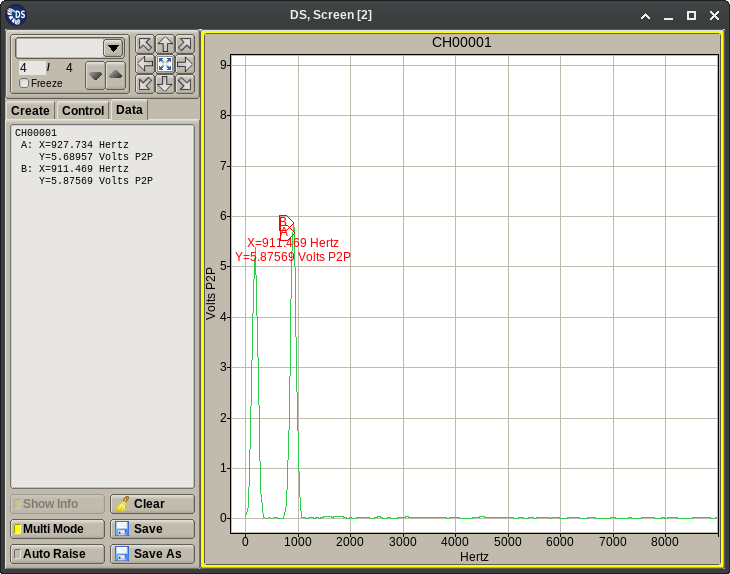
Clicking inside a non-empty plot cell’s data area adjacent (within a few pixels) to a data curve point will place a cursor on that plot. The cursor’s numerical read out will be added to the Data Tab described in the previous section, and depending on the plot type and available display space the text may also be shown on the plot itself.
Additional cursor types may be supported by certain plot types. These will be described in their respective sections.
