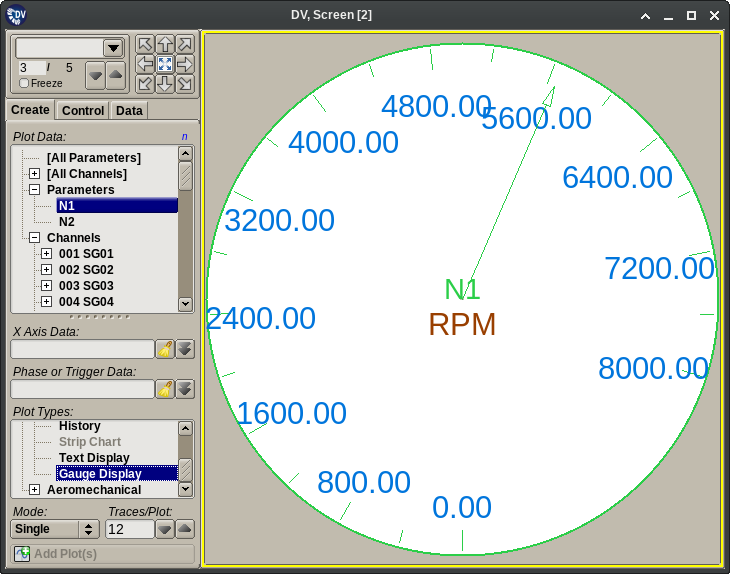
3.4.24. Gauge Plots
Gauge Plots show the current value of a parameter or channel stat on a round dial indicator display. These plots:
Require the selection of the following items on the Plot Creation tab before adding them to the plot grid:
- One primary parameter or channel stat.
Do not extend the Plot Menu with additional choices.
Do not add extra pages to the Plot Setup dialog.
Provide no additional user interaction mechanisms beyond the ‘standard’ ones described in the Plot Interactions section. However, they do disable the plot data zoom interaction.
