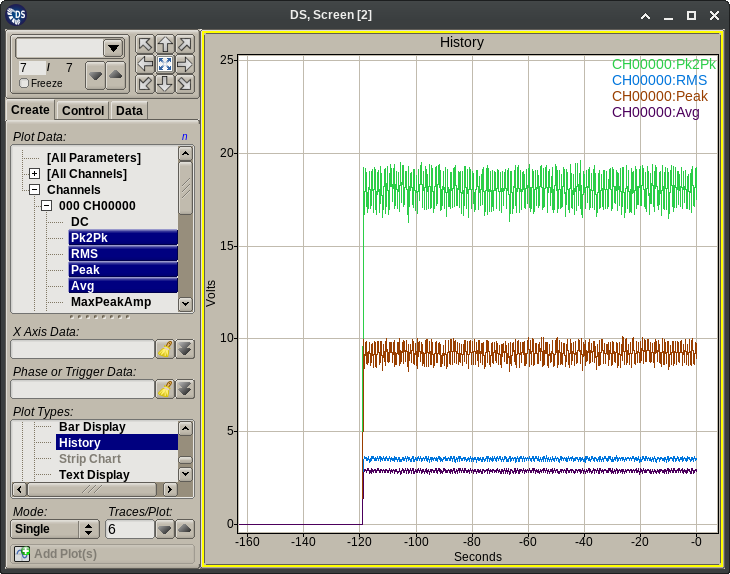
1.4.21. History Plots
History Plots display long term collected values for one or more parameters or channel stats. These plots:
Require the selection of the following items on the Plot Creation tab before adding them to the plot grid:
- One or more primary parameters or channel stats.
- Optionally, one parameter or channel stat to use as the X axis value instead of time.
Do not extend the Plot Menu with additional choices.
Do not add extra pages to the Plot Setup dialog.
Provide no additional user interaction mechanisms beyond the ‘standard’ ones described in the Plot Interactions section.
Time values displayed on the X axis (when not overridden) are negative, indicating that those values are from the past. History plots with a default X axis will scroll to the left as monitoring progresses. The time (or equivalent block) range of all history plots is equal to the value configured under the Storage Tab tab of the APEX DS Setup Editor dialog.
