1.4.16. Cross Spectrum Plots
Cross Spectrum Plots display the complex cross spectrum computed from the FFTs of the primary channel(s) and the reference channel. The computed cross spectrum can be displayed in various forms with or without averaging. These plots:
Require the selection of the following items on the Plot Creation tab before adding them to the plot grid:
- One or more primary data channels.
- One reference data channel.
Extend the Plot Menu with an additional sub-menu described below.
Do not add extra pages to the Plot Setup dialog.
Provide no additional user interaction mechanisms beyond the ‘standard’ ones described in the Plot Interactions section.
Cross Spectrum plots have three sub-types depending of the data curve being displayed:
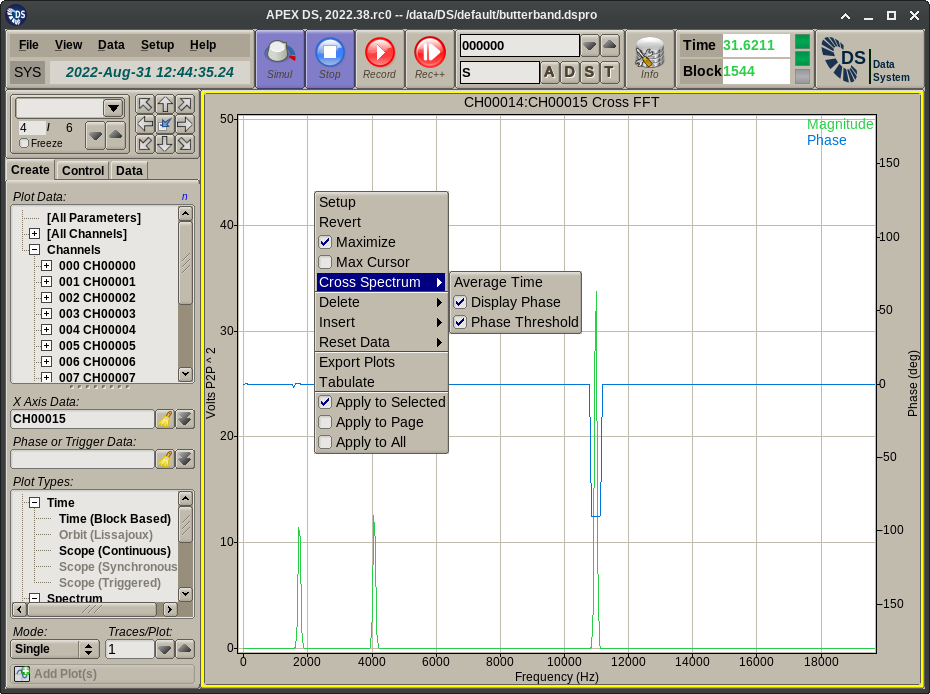
- Cross FFT displays the magnitude and optionally the phase of the complex cross spectrum computed from the FFTs of the primary and reference channels.
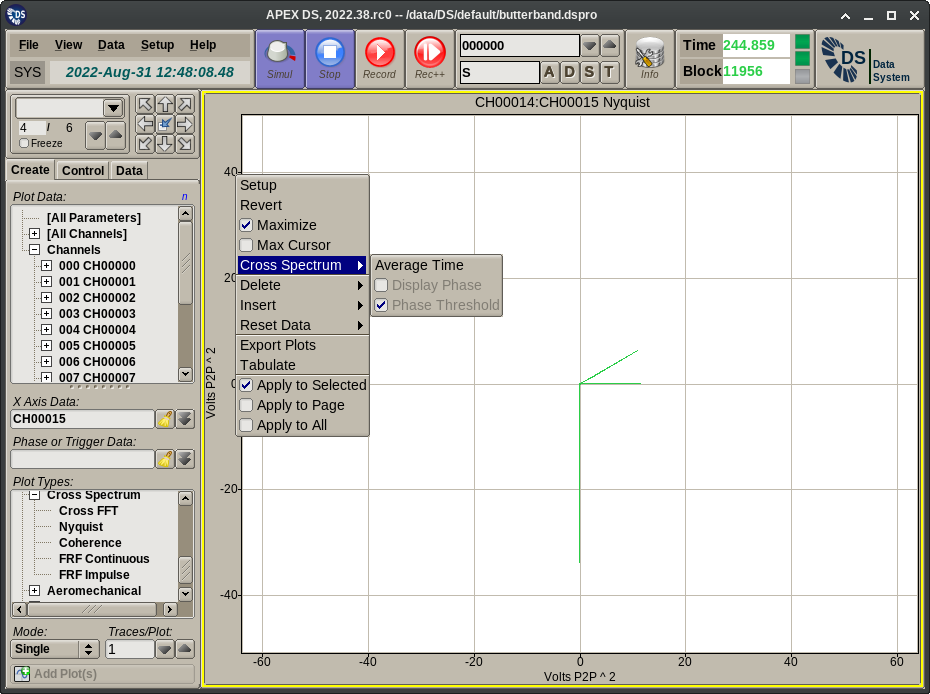
- Nyquist displays the complex cross spectrum computed from the FFTs of the primary and reference channels in a polar coordinate system.
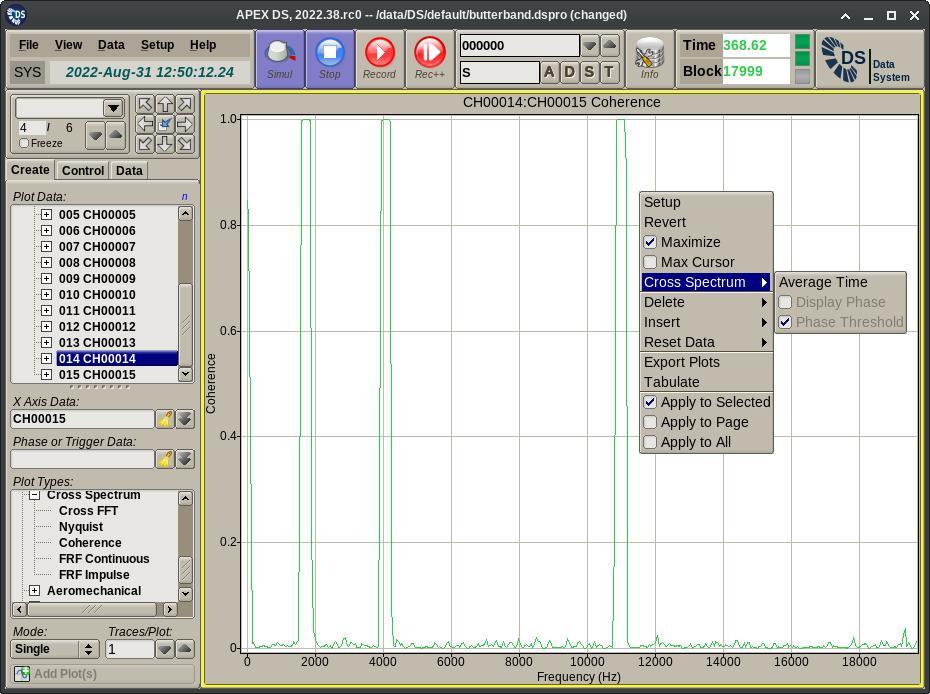
- Coherence displays the magnitude of the complex cross spectrum normalized against the product of the primary and reference channel FFT magnitudes. This plot will show unity at parts of the spectrum where the inputs are deterministic and less than unity where the input is noise.
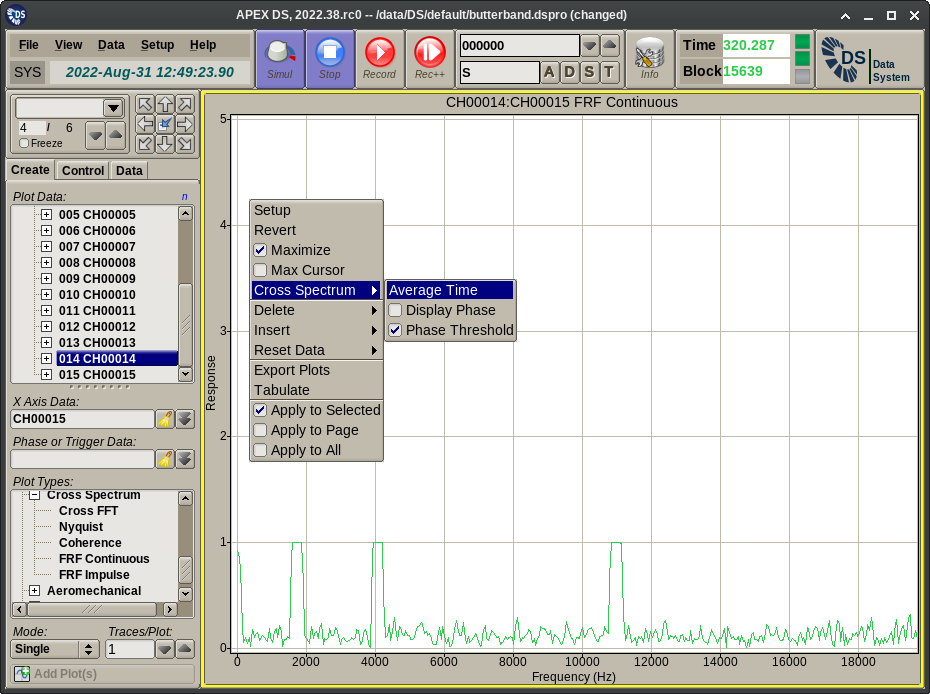
- FRF Continuous displays the magnitude and optionally the phase of the Frequency Response Function of the primary channel(s) versus the reference. This data is computed and collected for each block of the input data.
- FRF Impulse displays the magnitude and optionally the phase of the Frequency Response Function of the primary channel(s) versus the reference. This data is computed and collected only from those blocks of the input data that meet certain criteria. This mode of FRF data collection is mostly useful for impact testing. On these plots the FRF is collected and updated only from those data blocks that contain a complete, not truncated impact testing event.
The Plot Menu extension displayed for spectrum plots provides the following functionality:
- Average: Displays a dialog for the entry of the time interval over which the cross spectrum data should be averaged. Averaging is exponential. Entering 0 disables averaging.
- Display Phase: This toggles the display of the phase plot trace. This applies to Cross FFT and FRF plots only.
- Phase Threshold: This toggles the application of per channel FFT amplitude thresholds for the display of the phase curve (when applicable to the selected plot type). Typically in regions of the spectrum where the input is only noise the phase will be noise too. This option disables the display of this phase noise for frequency values where the magnitude of either of the inputs is below a threshold. The thresholds used here are the same as the peak extraction ones configured on the APEX DS Setup Editor page.
Tip
For correct operation of the “FRF Impulse” plots, the acquisition has to be configured in a specific way. The sample rate and block size should be configured such that the time interval covered by each block is longer than the time it takes for each impact event to complete. I.e. the exponentially decaying responses should (almost) completely disappear within the time frame of a single acquisition block. Additionally, for such applications the “rectangular” FFT window should be used (i.e. no window).


