1.4.3. Plot Scaling
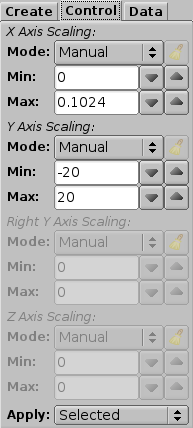
The Control Tab is the second possible view of the left side control area.
The tab is provided as a convenience, it allows quick access to all plot axis scaling on the selected plot(s) without having to invoke the full Plot Setup dialog. It provides the following controls for each active axis of the selected plot(s):
- Mode: Manual Use Min Range: and Max: to set axis scaling (default).
- Mode: Auto Automatically rescale the axis min and max to fit the currently visible data.
- Mode: Auto Hold Similar to the above option except never decrease the min or max values, i.e. it is a peak hold.
- Min: First value from the left appearing on the axis.
- Max: Last value from the left appearing on the axis.
- Apply: Selected Apply all changes made to axes of selected plots.
- Apply: Page Apply all changes made to all matching type plots on the current page.
- Apply: All Apply all changes made to all matching type plots on all pages.
The active axis control groups are determined by the type of the currently selected plot.
