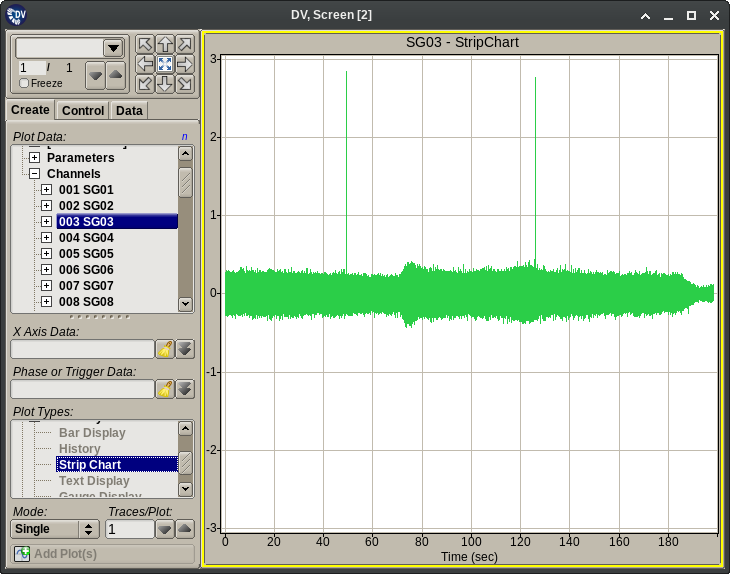
2.4.13. Strip Chart Plots
Strip Chart Plots display a longer term outline of the waverform(s) from one or more channels. These plots:
Require the selection of the following items on the Plot Creation tab before adding them to the plot grid:
- One or more primary data channels.
Do not extend the Plot Menu with additional choices.
Do not add extra pages to the Plot Setup dialog.
Provide no additional user interaction mechanisms beyond the ‘standard’ ones described in the Plot Interactions section.
Tip
Due to the way these plots are drawn, configuring more than one trace per plot is probably not very useful.
