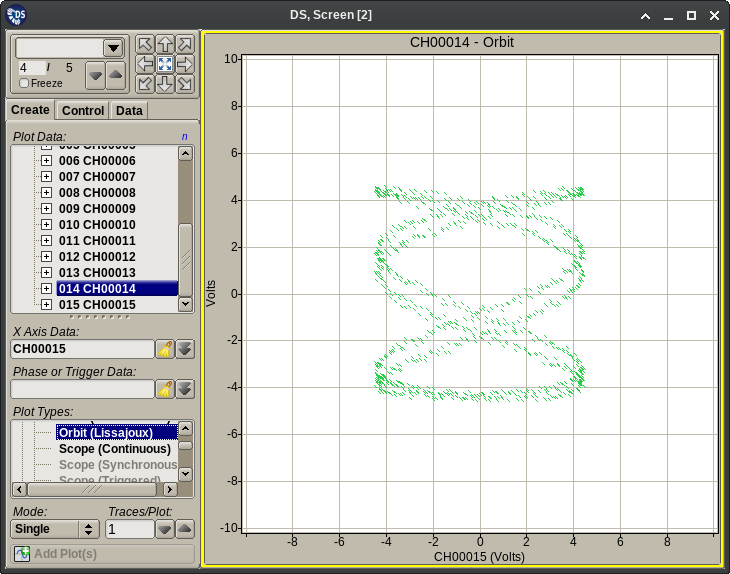
2.4.12. Orbit Plots
Orbit Plots (also known as Lissajoux plots) display the current data block’s samples from one or more channels on the Y axis against samples of one channel on the X axis. These plots:
Require the selection of the following items on the Plot Creation tab before adding them to the plot grid:
- One or more primary data channels.
- One data channel for the X axis.
Do not extend the Plot Menu with additional choices.
Do not add extra pages to the Plot Setup dialog.
Provide no additional user interaction mechanisms beyond the ‘standard’ ones described in the Plot Interactions section.
